TL;DR: Webinar Product Discovery Anti-Patterns — April 10th, 2018
Scrum has proven to be a practical product delivery framework for digital products like applications or apps. However, Scrum is equally suited to build the wrong product efficiently as its Achilles heel has always been the product discovery part. What product discovery part, you may think now. And this is precisely the point: The product owner miraculously identifies the best way to proceed as a team by gating and prioritizing the product backlog is. How that is supposed to happen is nowhere described in the Scrum Guide. Consequently, when everyone is for himself, product discovery anti-patterns emerge. I believe it is time to address this issue with the webinar product discovery anti-patterns.
From sunk costs, HIPPO-ism, my-budget-my-features to self-fulfilling prophecies — learn more about the numerous product discovery anti-patterns that can manifest themselves when you try to fill Scrum’s product discovery void.
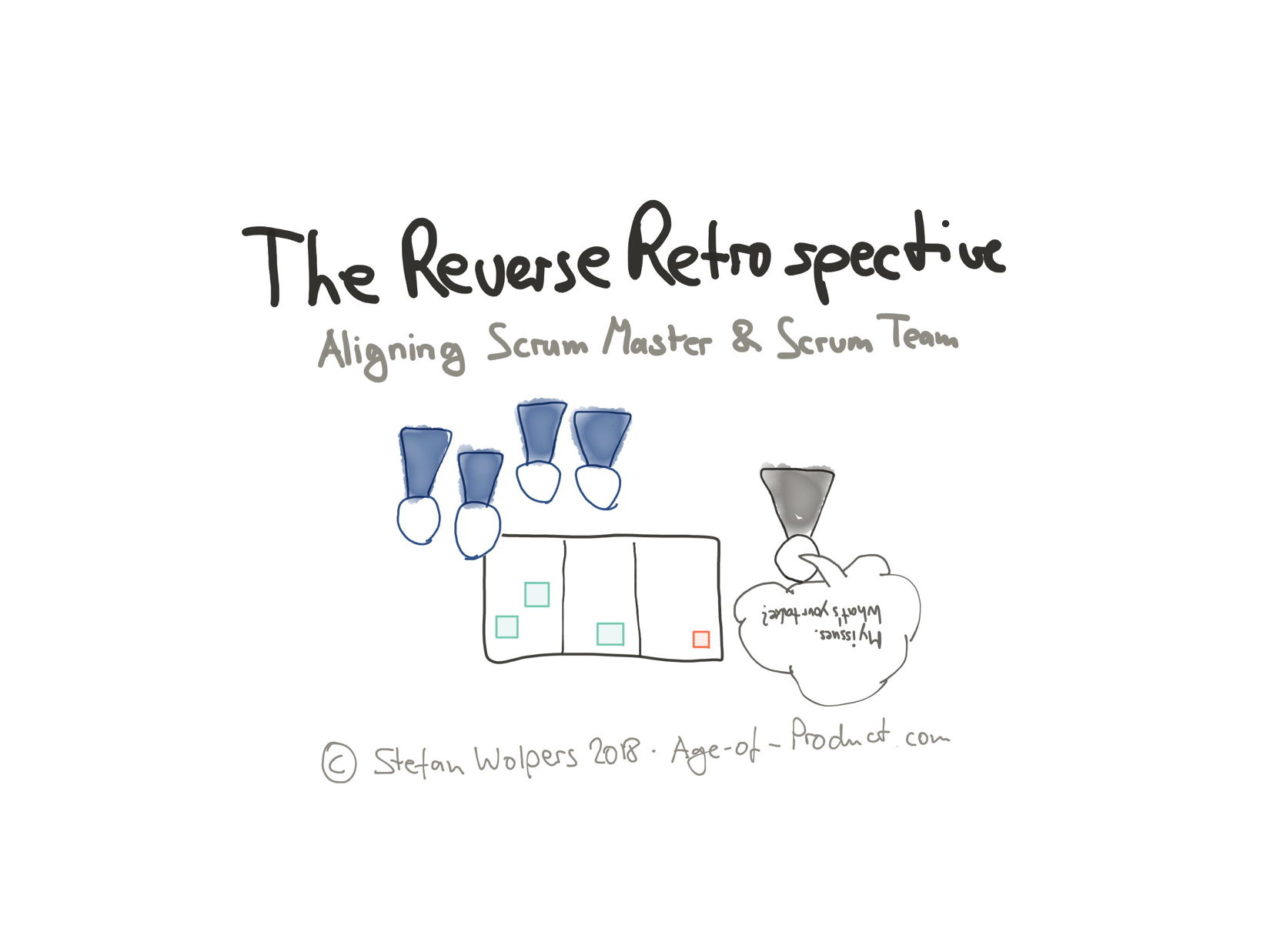
Are you—as a scrum master or agile coach—experiencing more communication kerfuffles with “your” team? Is its speed of improvement stalling? Are you under the impression that the team is slipping back into old habits and patterns? Maybe, it is time to run a reverse retrospective where you share your observations with the team.
Learn how to run a reverse retrospective to realign with your scrum team.
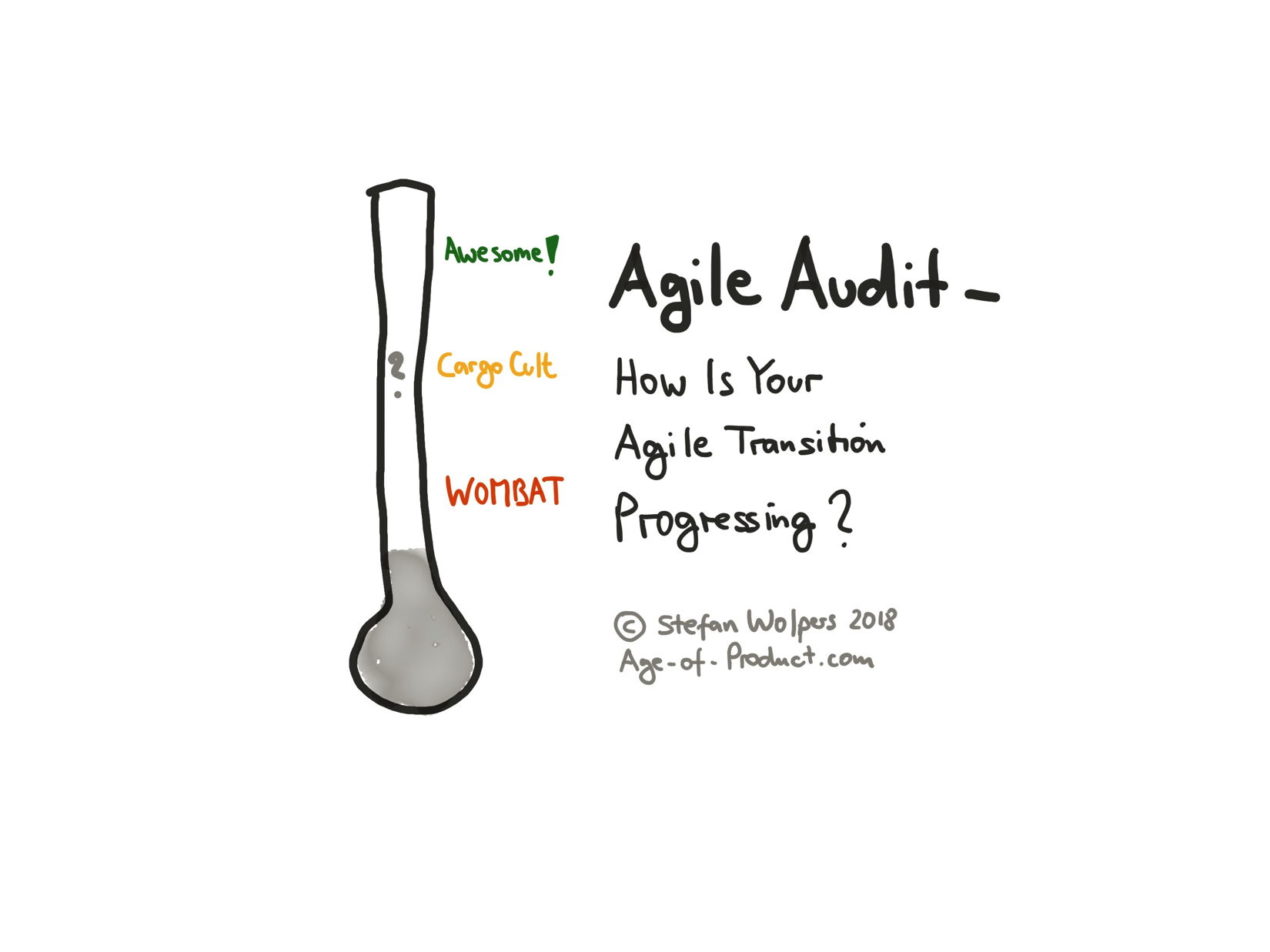
Supposedly, becoming agile is a journey, not a destination. This is a convenient narrative if the viability of your consultancy depends on selling men and materiel. The fuzzier the objective of an agile transition the less likely there will be an agile audit addressing the return on investment question the customer might have.
Moreover, a fuzzy objective such as ‘we want to become an agile organization’ is probably the reason for applying the same methodologies indiscriminately to every organization—a one size fits all approach for agile transitions.
However, what if not every organization embarking on a transition to agile practices is meant to become a teal organization or a holacracy? What if being late to the agile transition party is instead a deliberate choice than a manifestation of hubris, ignorance or leadership failure?
Read more on why feedback loops in the form of an agile audit are beneficial for organizations and teams alike.
TL;DR: Use Burn-Down Charts to Discover Scrum Anti-Patterns
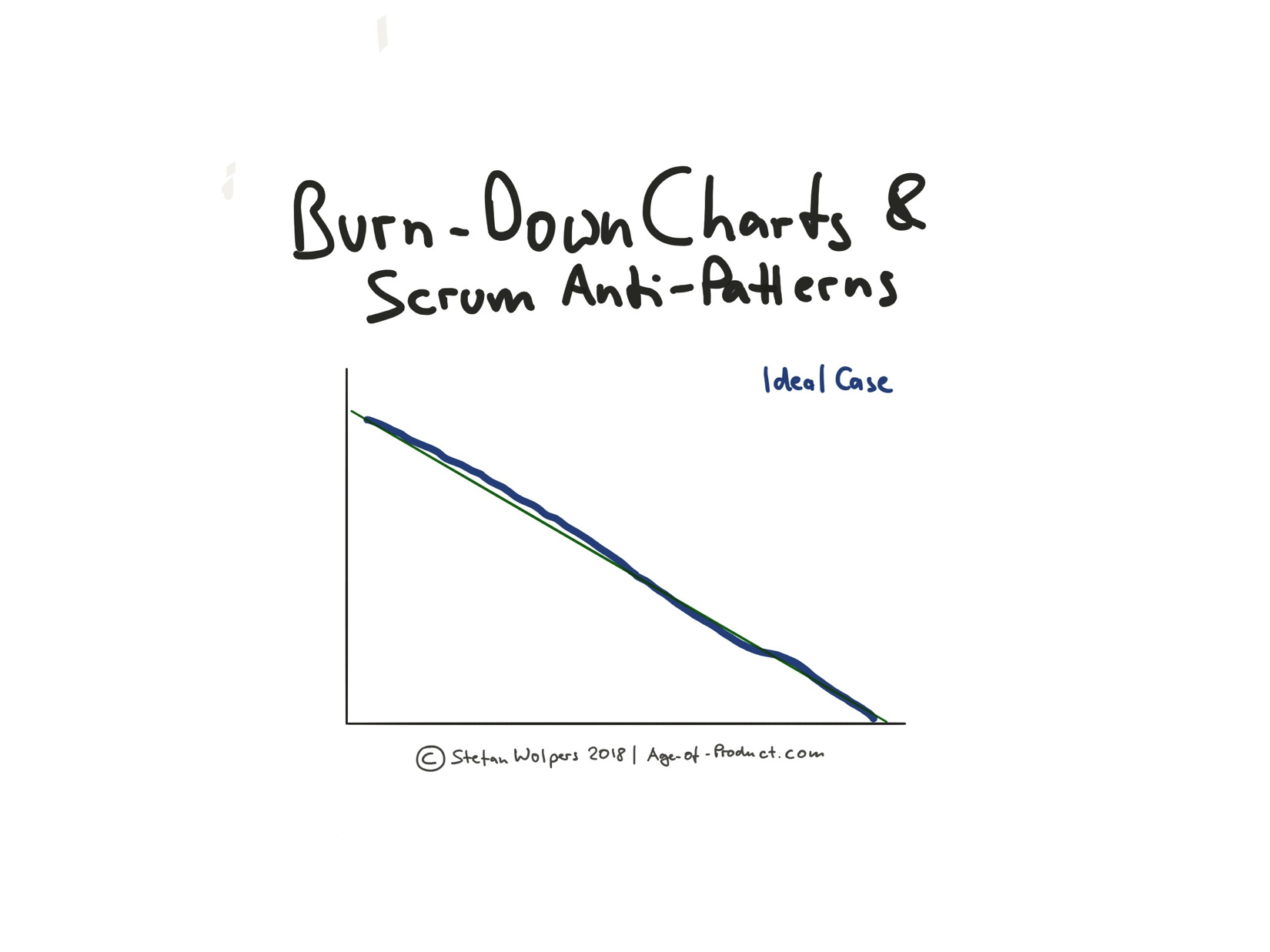
A burn-down chart tracks the progress of a team toward a goal by visualizing the remaining work in comparison to the available time. So far, so good. More interesting than reporting a status, however, is the fact that burn-down charts also visualize Scrum anti-patterns of a team or its organization.
Learn more about discovering these anti-patterns that can range from systemic issues like queues outside a team’s sphere of influence and other organizational debt to a team’s fluency in agile practices.
TL;DR: How to Measure Agility of Organizations and Teams
Is every organization suited to become ‘agile?’ If so: How to measure agility? And if not: Wouldn’t it be great figuring that out before embarking on a futile and expensive journey?
On February 3rd, 2018, 20-plus people will join a hackathon to build an agility assessment framework based on this taxonomy. The goal of the workshop is to provide the first version of a tool that empowers agile practitioners to measure agility, be it an organization’s suitability for agile practices or a team’s progress on its path to becoming agile.
by Stefan Wolpers|Agile TransitionLean and Product
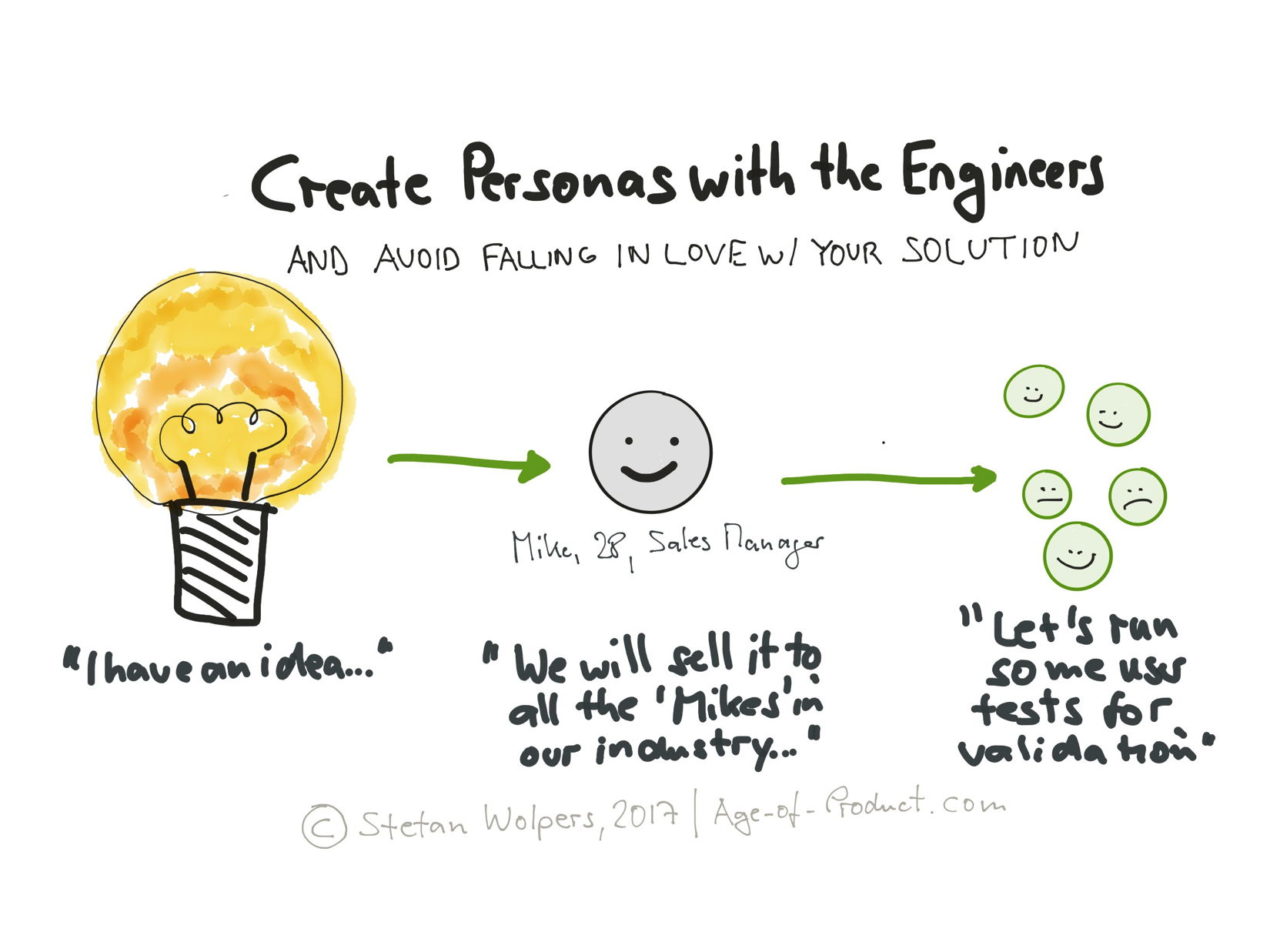
TL; DR: Create Personas with the Help of the Engineers
Creating valuable software requires knowing the customer—we all agree on that, right? The first question that then comes to mind is how to support this product discovery process in a meaningful manner in an agile environment? And the second question follows swiftly: who shall participate in the process—designers and business analysts or the engineers, too?
Read on and learn why personas are useful for product discovery purposes, how to create personas, and why the complete team—including the engineers—needs to participate in their creation.