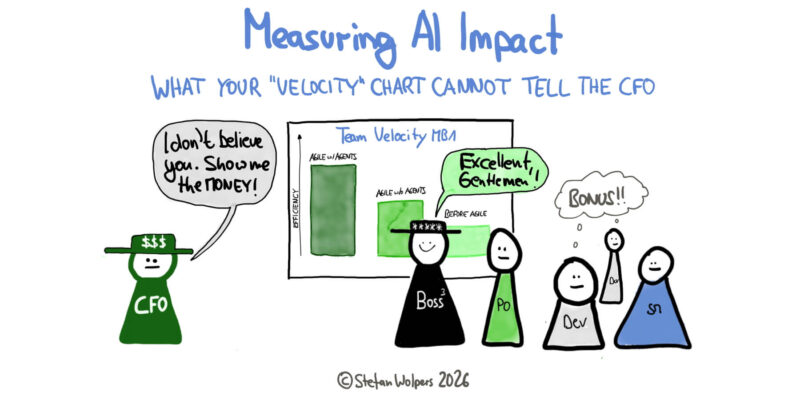
TL;DR: What Your Velocity Chart Cannot Tell the CFO
Sooner or later, someone in your organization shows a slide with a number about what AI did for your team: typically, the team’s “velocity” before and after the coding agents arrived, plus a percentage that looks like a return on the token bill. The number may even be “correct”; however, it answers a different question than the one finance is asking: A before-and-after comparison credits every change in that period to the agents, and measuring velocity is controversial for good reason under normal circumstances, which makes measuring AI impact by this means even more challenging.
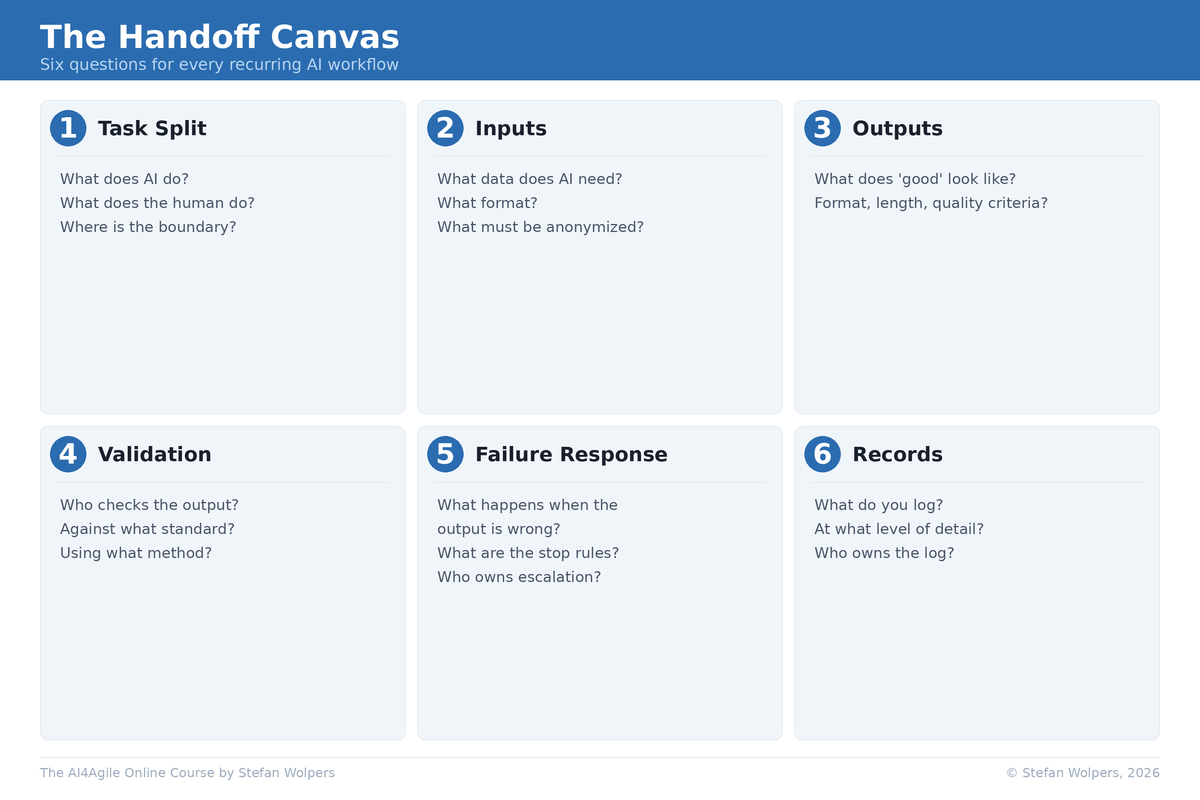
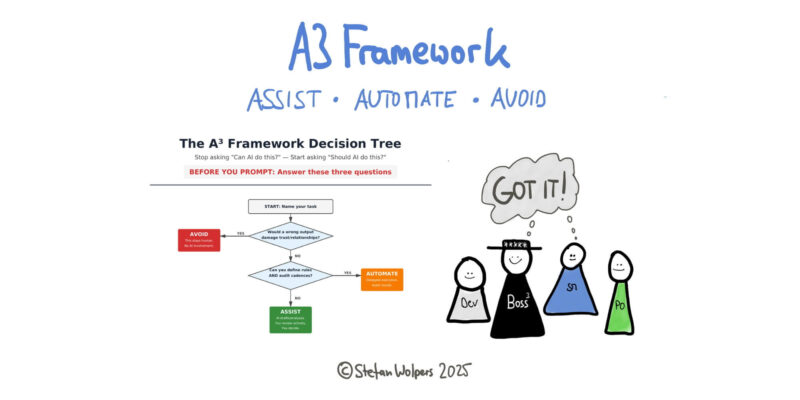
A claim your team can defend starts elsewhere: with an honest grade of the evidence, a break-even test for every delegated AI workflow, and the creep check of the AI Delegation Audit, which catches the workflows that pass the test only because nobody reviews their output anymore. Each workflow then gets a keep, change, or retire decision in the Re-classification Log, and the result fits on one page that states what the team can claim and what it cannot. Bonus: For your own work, a small trial of eight to ten runs gives you a direction you can act on.
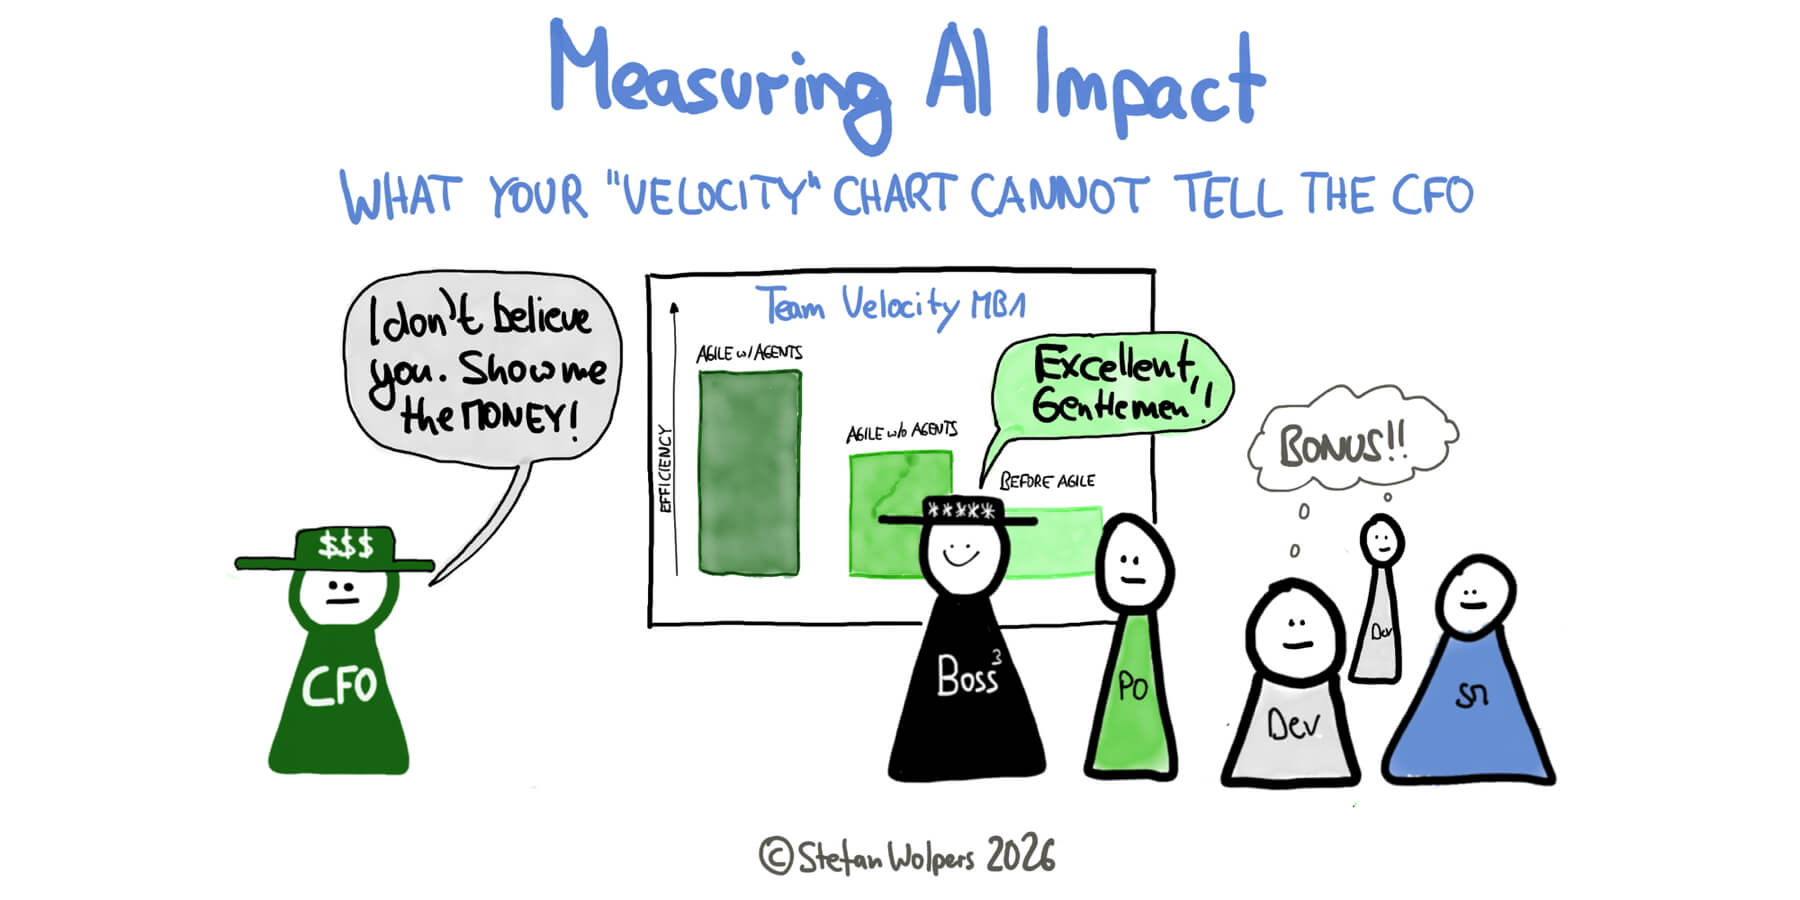
Thesis: This article explains how agile teams can measure AI impact effectively, why before-and-after velocity charts mislead, the three grades of evidence, a break-even test for delegated workflows, a one-page statement for finance, and a personal trial.