
TL; DR: Agile Metrics
Suitable agile metrics reflect either a team’s progress in becoming agile or your organization’s progress in becoming a learning organization.
At the team level, qualitative agile metrics often work better than quantitative metrics. At the organizational level, this is reversed: quantitative agile metrics provide better insights than qualitative ones.
Update 2020-08-24: I added more graphics and examples and fixed content debt.
🏅 The most popular discussion on LinkedIn last week was: Who Writes Documentation When Working Software Is More Important?
🗞 Shall I notify you about articles like this one? Awesome! You can sign up here for the ‘Food for Agile Thought’ newsletter and join 47,000-plus subscribers.

🎓 Join Stefan on October 24-25, 2023, in Berlin: Advanced Professional Scrum Master Training in Berlin w/ PSM II Certificate — October 24-25, 2023.
Good Agile Metrics
Generally speaking, metrics help to understand the current situation better and allow us to gain insight on change over time. Without metrics, assessing any effort or development will be open to gut feeling and bias-based interpretation.
A metric should, therefore, be a leading indicator for a pattern change, providing an opportunity to analyze the cause in time. The following three general rules for agile metrics have proven to be useful:
- The first rule of meaningful metrics is only to track those that apply to the team. Ignore those that measure the individual.
- The second rule of meaningful metrics is not to measure parameters just because they are easy to track. This practice often is a consequence of using various agile project management tools that offer out-of-the-box reports.
- The third rule of meaningful metrics is to record context as well. Data without context, for example, the number of the available team member, or the intensity of incidents during a Sprint, maybe turn out to be nothing more than noise.
For example, if the (average) sentiment on the technical debt metric (see below) is slowly but steadily decreasing, it may indicate that:
- A team may have started sacrificing code quality to meet (arbitrary) deadlines, or
- A team may have deliberately built some temporary solutions to speed up experimentation.
While the latter probably is a good thing, the first interpretation is worrying. (You would need to analyze this with the team during a Sprint Retrospective.)
Cannot see the form? Please click here.
Good Qualitative Team Metrics: Self-Assessment Tests
If you like to track a team’s progress in adopting agile techniques and processes, self-assessment tests are well-suited for that purpose. For example, I like to use the Scrum Checklist by Henrik Kniberg.
All you have to do, is to run the questionnaire every four to six weeks during a retrospective, record the results, and aggregate them:
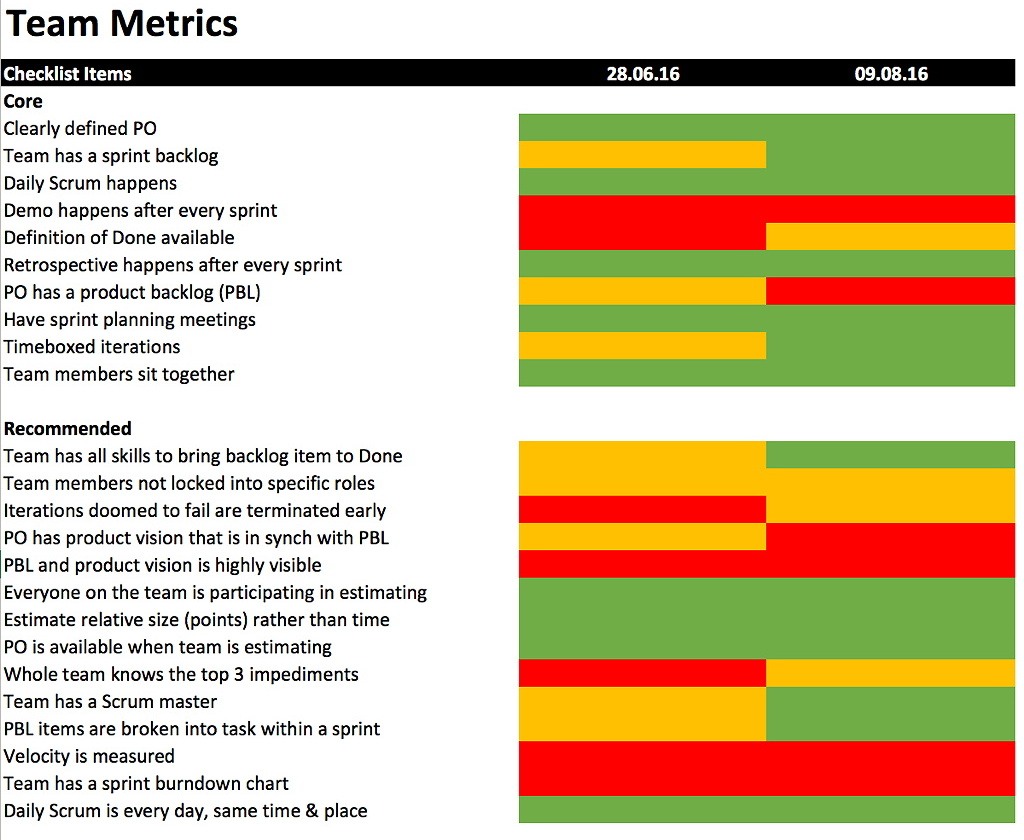
In this example, we were using a kind of estimation poker to answer each question with one of the three values green, orange, and red. The colors were coded as follows:
- Green: It works for the team.
- Orange: It workes for the team but there is room for improvement.
- Red: It either does not apply, for example, the team is not using burndown charts, or the practice is still failing.
If the resulting Scrum practices map is getting greener over time, the Scrum Team is on the right track. Otherwise, you have to dig deeper to understand the reasons why there is no continuous improvement and adapt accordingly. This form of data is valuable input for Sprint Retrospectives and discussions with the management, for example, to demonstrate the need for further training.
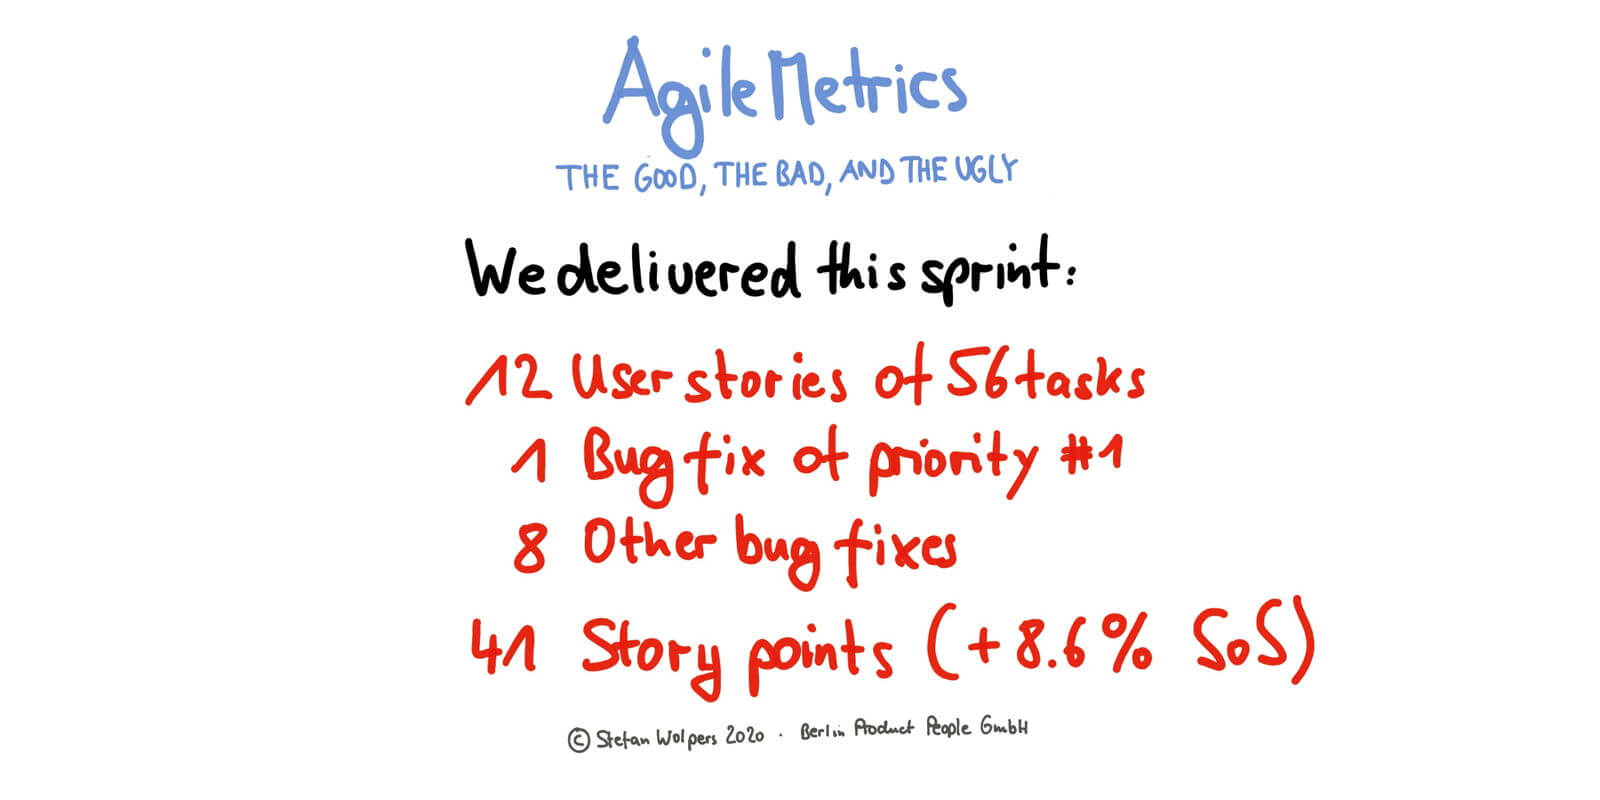
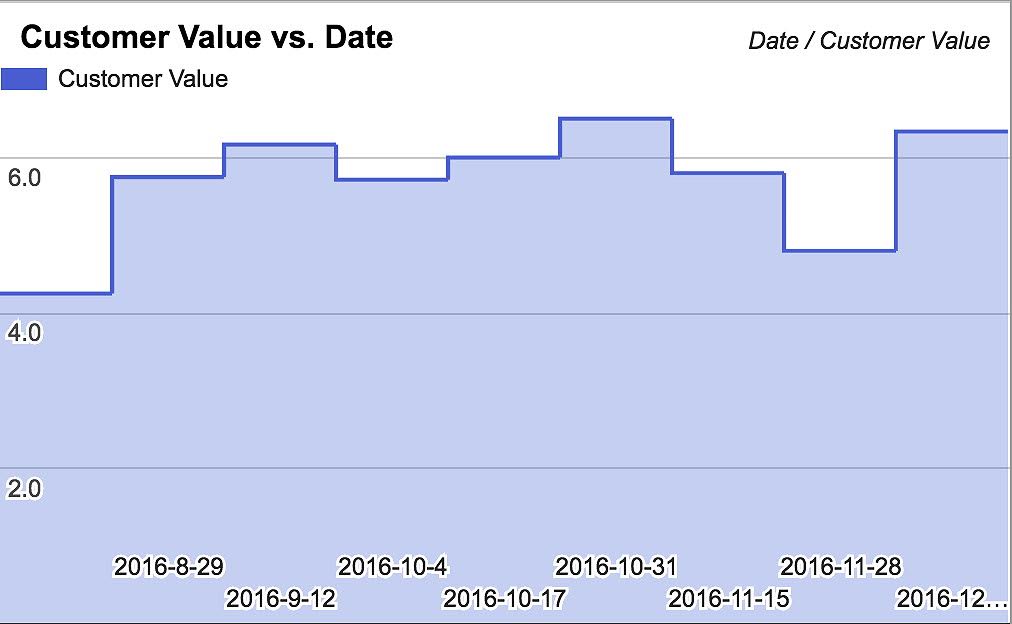
In addition to this exercise, I also like to run an anonymous poll at the end of every Sprint. The poll is comprising of four questions that are each answered on a scale from 1 to 10:
- What value did the team deliver the last sprint? (1: we didn’t deliver any value; 10: we delivered the maximum value possible.)

- How has the level of technical debt developed during the last sprint? (1: rewrite the application from scratch; 10: there is no technical debt.)
- Would you recommend a job opportunity in this organization to a friend with an agile mindset? (1: No, I value the friendship more than this organization; 10: Without hesitation.)
- Are you happy working with your teammates? (1: No, I am already looking for a new job; 10: Yub, I cannot wait to get back to the office on Monday mornings.)
The poll takes less than 60 seconds of each team member’s time, and the results are of course available to everyone. Again, tracking the development of the four qualitative metrics provides insight into trends that otherwise might go unnoticed. Again, the data provides good input for a Sprint Retrospective.
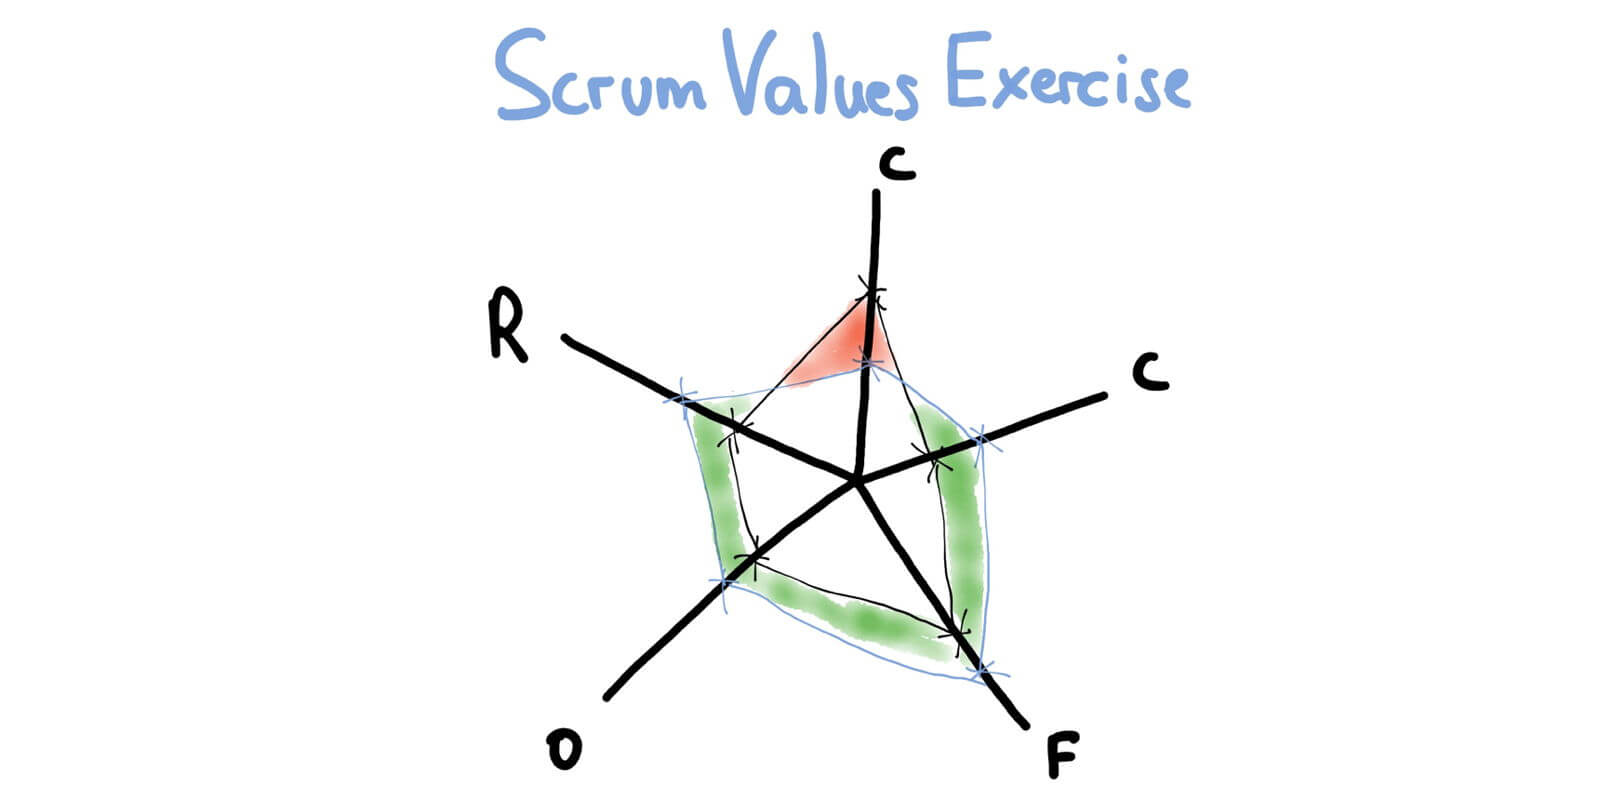
Good Qualitative Team Metrics: The State of Scrum Values
Another good use of a regular anonymous poll is the state of Scrum values within a Scrum team. You create a poll of five questions, covering commitment, courage, focus, openness, and respect, using a Likert scale. (“1” might be “The Scrum value not practiced at all” and “5” might represent “the Scrum team is perfect at [Scrum value].”)
If you run the poll several times and visualize the data with a spider diagram, you can easily track the Scrum Team’s progress regarding Scrum values:
Good Quantitative Agile Metrics: Lead Time and Cycle Time
Ultimately, the purpose of any agile transition is to become a learning organization, thus gaining a competitive advantage over your rivals. The following metrics apply to the (software) product delivery process but can be adapted to various other processes accordingly.
In the long run, this will not only require to restructure the organization from functional silos to cross-functional, self-organizing teams, where applicable. It will also require analyzing the system itself, for example, figuring out where unnecessary queues impede value creation.
To identify the existing queues in the product delivery process, you start recording five dates:
- The date when a previously validated idea, for example, a user story for a new feature, becomes a product backlog item.
- The date when this product backlog item becomes a sprint backlog item.
- The date when development starts on this sprint backlog item.
- The date when the sprint backlog item meets the team’s ‘Definition of Done’.
- The date when the sprint backlog item is released to customers.
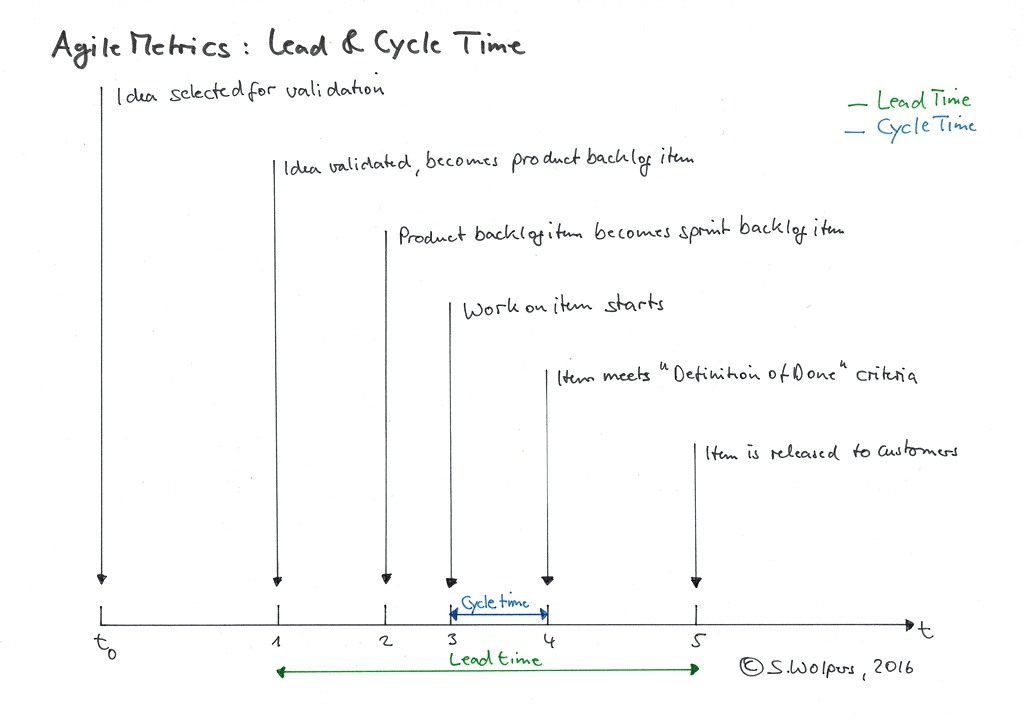
The lead time is the time elapsed between first and the fifth date, the cycle time the time elapsed between third and the fourth date.
The objective is to reduce both lead time and cycle time to improve the organization’s capability to deliver value to customers. The purpose is accomplished by eliminating dependencies and hand-overs between teams within the product delivery process.
Helpful practices in this respect are:
- Creating cross-functional teams
- Having feature teams instead of component teams
- Furthering a holistic, whole-product perspective, and systems thinking among all team members.
Measuring lead time and cycle time does not require a fancy agile tool or business intelligence software. A simple spreadsheet will do if all teams stick to a simple rule: note the date once you move a ticket. The method even works with index cards, see below.
The following graphic compares median values of lead time and cycle time of three Scrum teams:
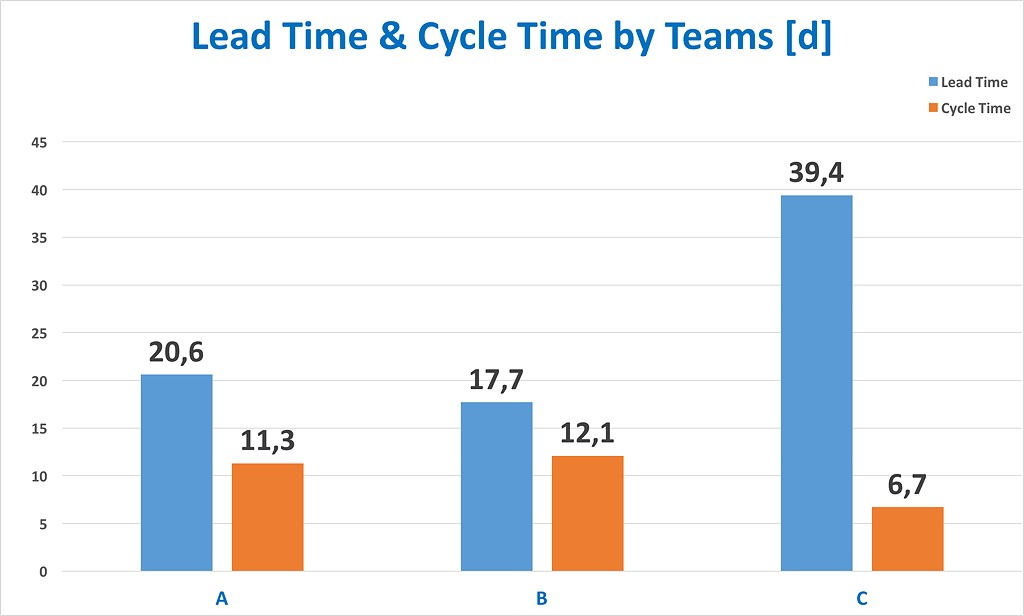
The values were derived from analyzing tickets—both user stories as well as bug tickets—from a period of three months. The Sprint length was two weeks.
Other Good Agile Metrics
Esther Derby suggests to also measure the ratio of fixing work to feature work, and the number of defects escaping to production.
Another good source for actionable agile metrics is the State of DevOps Report.
Bad Agile Metrics
A controversial, yet traditional agile metric is team velocity. Team velocity is a notoriously volatile metric, and hence actually only usable by an experienced team itself.
Some of the many factors that make even intra-team sprint comparisons so difficult are:
- The team onboards new members,
- Veteran team members leave,
- Seniority levels of team members change,
- The team is working in unchartered territory,
- The team is working on legacy code,
- The team is running into unexpected technical debt,
- Holiday & sick leave reduce capacity during the sprint,
- The canteen serves bad food,
- The team had to deal with serious bugs.
Actually, you would need to normalize a team’s performance each Sprint to derive a value of at least some comparable value. (Which usually is not done.)
Additionally, velocity is a metric that can be easily manipulated. I usually include an exercise on how to cook the “agile books” when coaching new teams. And I have never worked with a team that did not manage to come up with suitable ideas on how to make sure that it would meet any reporting requirements based on its velocity. You should not be surprised by this—it is referred to as the Hawthorne effect:
The Hawthorne effect (also referred to as the observer effect) is a type of reactivity in which individuals modify or improve an aspect of their behavior in response to their awareness of being observed.
To make things worse, you cannot compare velocities between different teams since all of them are estimating differently. This practice is acceptable, of course, as estimates are usually not pursued merely for reporting purposes. Estimates are no more than a side-effect of the attempt to create a shared understanding among team members on the why, how, and what of a work item.
Read more on velocity here Scrum: The Obsession with Commitment Matching Velocity and here Faking Agile Metrics or Cooking the Agile Books.
Ugly Agile Metrics
The ugliest agile metric I have encountered so far is ‘story points per developer per time interval.’ This metric equals ‘lines of code’ or ‘hours spent’ from a traditional project reporting approach. The metric is completely useless, as it doesn’t provide any context for interpretation or comparison.
Equally useless “agile metrics” are, for example, the number of certified team members, or the number of team members that accomplished workshops on agile practices.

Conclusion
If you can only record a few data points, go with start and end dates to measure lead time and cycle time. If you have just started your agile journey, you may consider also tracking the adoption rate of an individual team by measuring qualitative signals, for example, based on self-assessment tests like the ‘Scrum test’ by Henrik Kniberg.
What do you measure to track your progress as a team? Please share your agile metrics with us in the comments, or join our Slack team “Hands-on Agile”—we have a channel for agile metrics.
📖 Related Posts
How to Kick-off Your Agile Transition
📅 Scrum Training Classes, Workshops, and Events
You can secure your seat for Scrum training classes, workshops, and meetups directly by following the corresponding link in the table below:
See all upcoming classes here.
You can book your seat for the training directly by following the corresponding links to the ticket shop. If the procurement process of your organization requires a different purchasing process, please contact Berlin Product People GmbH directly.
✋ Do Not Miss Out and Learn more about Agile Metrics: Join the 12,000-plus Strong ‘Hands-on Agile’ Slack Team and Learn more about Agile Metrics
I invite you to join the “Hands-on Agile” Slack team and enjoy the benefits of a fast-growing, vibrant community of agile practitioners from around the world.
If you like to join now all you have to do now is provide your credentials via this Google form, and I will sign you up. By the way, it’s free.
Thanks for pointing at the typo! 🙏
Please consider correcting small typo in the first paragraph of “Conclusion” section:
“If…to measure lead time and circle time.” should be “If…to measure lead time and cycle time.”
Measuring the time for idea generation to shipping the product/product increment?
How can we calculate Time-To-Market metric in our projects ? Is there any formula to use ?
Hi, really good article.
It was a lot of helpfull tips.
Also i want to share with you one more interesting article, we’ve prepared recently: it’s about agile metrics to measure productivity of software developers (https://svitla.com/blog/agile-metrics-to-measure-productivity-of-your-software-development-team)
We use a relative value by defining the “highest value sprint” of the past and then comparing other sprints to that one. It is admittedly a bit fuzzy, but all three questions are supposed to be answered without much thinking. It takes usually less than 15 seconds to do so.
What are your units of measure of “value”?